matlab作图 - webdancer's Blog
matlab作图
matlab提供了很多的方法来作图。通过图像我们能够直观的来观察数据中的重要特征。我们可以根据我们的数据来选择作图的类型,比如:line,bar,histogram,pie等;还可以用来做三维图形,比如:surfaces等。
我们有有种基本的作图方式,命令行和作图工具。当然,我们可以把它们结合起来,比如用命令行作图后,用作图工具来修改。
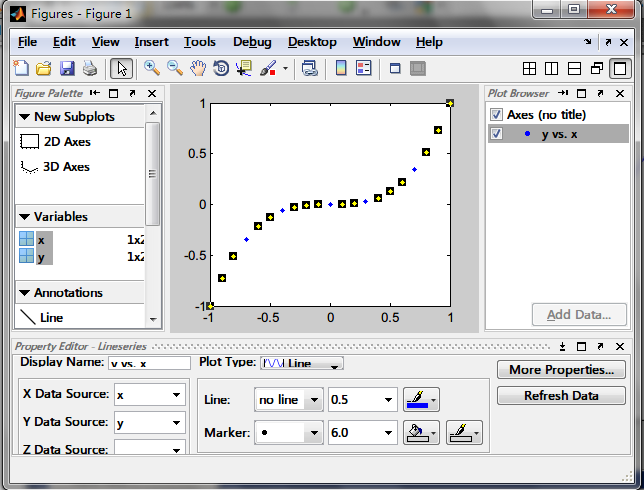
1.使用plottools作图。
使用GUI的作图工具,可以实现很强大的功能。帮助文档介绍很详细。
2.作图函数。
这时我们在编程时需要的,可以自动的进行数据可视化。
数据:
>>X=-2*pi:.1:2*pi
>>Y=sin(X)
具体函数:
二维作图:plot
x坐标轴:xlabel
y坐标轴:ylabel
标题:title
注意:xlabel,ylabel,title都可以用tex的语法来写数学公式。
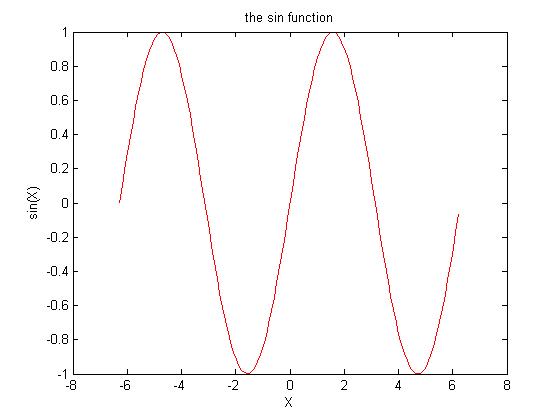
例子:
%作sin(x)的图像
>>plot(X,Y,'r');
>>xlabel('X');
>>ylabel('sin(X)');
>>title('the sin function');
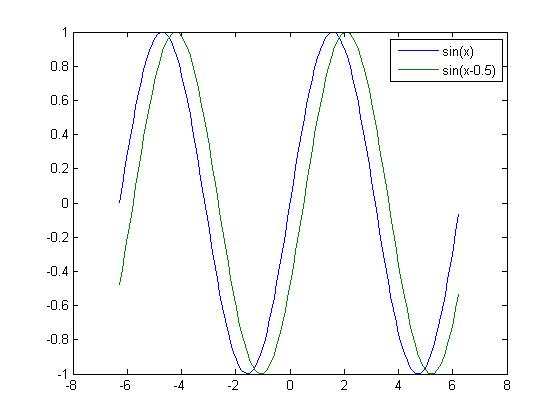
通过修改plot的参数,可以同时画出多个函数
例如:
>>plot(X,Y,X,sin(X-.5));
>>legend('sin(x)','sin(x-0.5)'); %标注不同的函数
当然plot还有很多的参数,用来定义图像的外观。
holdon 可以让我们继续往前面的图像上添加函数。
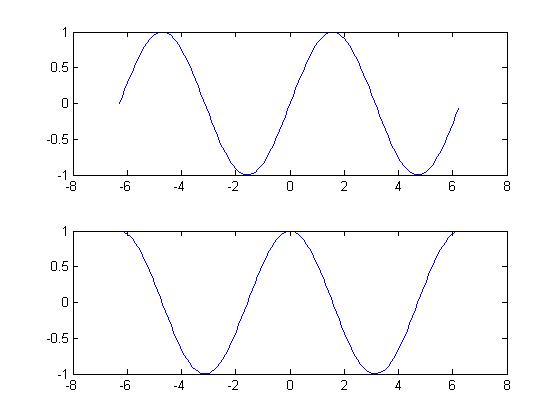
subplot可以使我们在一个图像中使用多个坐标系。
例子:
>>subplot(2,1,1);plot(X,sin(X));
>>subplot(2,1,2);plot(X,cos(X));
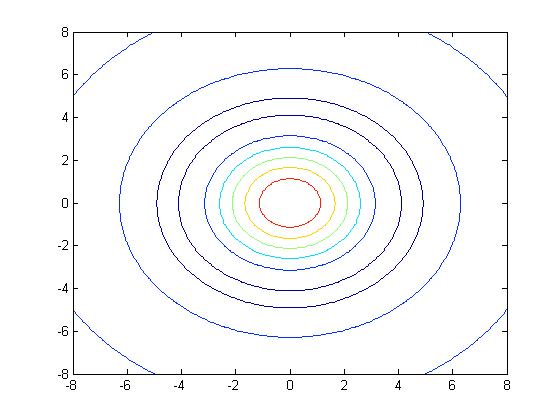
mesh, surface ,contour
>> [X,Y]=meshgrid(-8:.1:8);
>> R=sqrt(X.^2+Y.^2)+eps;
>> Z=sin(R)./R;
>> mesh(X,Y,Z);
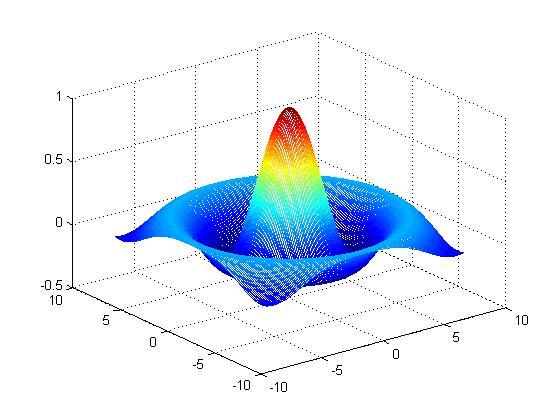
>>surf(X,Y,Z);
类似mesh
>>contour(X,Y,Z);
当然,使用matlab做好图形还需在实践中慢慢积累。
 评论 (0)