webdancer's Blog
matlab编程3—添加工具箱
在matlab程序设计中,如果我们要引入别人的写好的工具箱,怎么做呢?
首先,介绍一下matlab中的两个概念:current directory 和 search directory。matlab中的文件操作将这两个文件夹作为引用点,所以我们的文件必须在这两个之一。
1.current directory
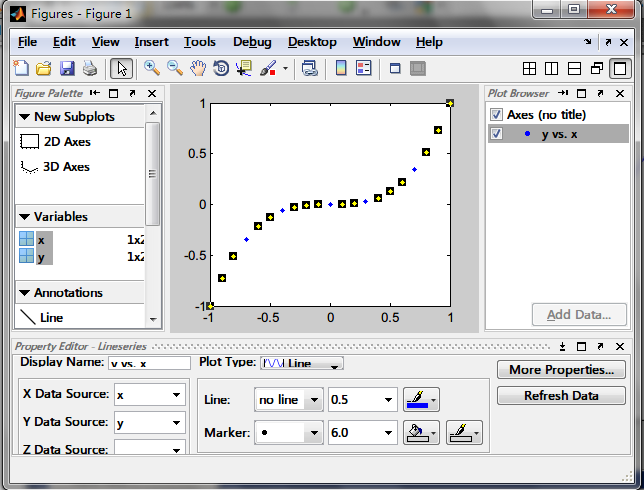
current directory在matlab的GUI的matlab toolbars中默认显示,我们很容易更改current directory.如下图:

2.search directory
安装工具箱,就是将工具箱路径,添加到search directory中。
有两种方式:
- 命令行。addpath(genpath('/path/to/targettoolbox'))
- 通过GUI界面。选择File-->setpath添加。
注意:matlab中,搜索目录中的函数在统一命名空间,这样如果函数重名,是一个比较让人不好办的问题。如果自己写的函数,不要与matlab内置函数重名;如果第三方toolboxs有重名现象,只好改名了。
matlab编程2
matlab里面记录代码的文件成为M-files。可以分为两种类型:script和function。
1.script。不接受输入,也不返回输出。它对workspace的数据进行操作。和python等的脚本文件是一样的,把在控制台的命令给保存起来。
2.function。接受输入参数,返回输出。这类文件的一个注意的地方就是文件名和函数名必须相同.
例子:
function r = rank(A,tol)
%RANK   Matrix rank.
%   RANK(A) provides an estimate of the number of linearly
%   independent rows or columns of a matrix A.
%   RANK(A,tol) is the number of singular values of A
%   that are larger than tol.
%   RANK(A) uses the default tol = max(size(A)) * eps(norm(A)).
%
%   Class support for input A:
%      float: double, single

%   Copyright 1984-2007 The MathWorks, Inc.
%   $Revision: 5.11.4.5 $  $Date: 2007/08/03 21:26:23 $

s = svd(A);
if nargin==1
   tol = max(size(A)) * eps(max(s));
end
r = sum(s > tol);
从这个例子中,看出:
1.从第一行看出,文件名与函数名一致。
2.%的行为注释,用help rank可以查看(当然,help方法删掉了一些没用的,比如最后两行)。
3.下面为函数体,是函数的实现。参数的参数数目可以用方法nargin和nargout获得。(n/arg/in)
function可以分为以下几种类型:
1.匿名函数。
不用创建专门的m文件,可在命令行,m文件内部创建。语法如下
f=@(arglist) expression
例子:
>> sqrt=@(x) x.^(1/2);
2.主函数和子函数。
函数类型的M文件需要一个主函数,放在第一位;后面可以跟若干个子函数(当然可以不跟)。
3.私有函数。
只对一些函数可见,放在名称为:private的目录下面。
4.嵌套函数。
在函数体内,定义新的函数。
提示:
构造字符串参数
用[]可以连接字符串,很容易来构造所需要的参数。
例子:
for i=1:10,
    s=['index' int2str(i) '.dat'];
    load(s);
end
特殊的函数:
eval:可以执行matlab命令。
例子:
>> cmd='1+1';
>> eval(cmd)
函数句柄:
使用@符号,可以获得matlab函数的句柄。这通常在把matlab函数作为参数的时候非常有用。
function [f,g] = myfun(x)
f = 3*x(1)^2 + 2*x(1)*x(2) + x(2)^2;    % Cost function
if nargout > 1
   g(1) = 6*x(1)+2*x(2);
   g(2) = 2*x(1)+2*x(2);
end

options = optimset('GradObj','on');
x0 = [1,1];
[x,fval] = fminunc(@myfun,x0,options);
使用矩阵运算代替迭代。
在matlab中矩阵运算都经过优化,速度较快。
matlab编程1
if condition1,
   statement1
elseif condition2,
   statement2
else,
   statement3
end
switch variable
    case constant1,
        statement1
    case constant2,
        statement2,
    otherwise,
        statement3
end
n = floor(real(double(n(1))));

if mod(n,2) == 1
   % Odd order
   M = oddOrderMagicSquare(n);
elseif mod(n,4) == 0
   % Doubly even order.
   % Doubly even order.
   J = fix(mod(1:n,4)/2);
   K = bsxfun(@eq,J',J);
   M = bsxfun(@plus,(1:n:(n*n))',0:n-1);
   M(K) = n*n+1 - M(K);
else
   % Singly even order.
   p = n/2;   %p is odd.
   M = oddOrderMagicSquare(p);
   M = [M M+2*p^2; M+3*p^2 M+p^2];
   if n == 2
      return
   end
   i = (1:p)';
   k = (n-2)/4;
   j = [1:k (n-k+2):n];
   M([i; i+p],j) = M([i+p; i],j);
   i = k+1;
   j = [1 i];
   M([i; i+p],j) = M([i+p; i],j);
end
for condition,
    statement;
end
while condition,
      statement;
end
a = 0; fa = -Inf;
b = 3; fb = Inf;
while b-a > eps*b
   x = (a+b)/2;
   fx = x^3-2*x-5;
   if fx == 0
      break
   elseif sign(fx) == sign(fa)
      a = x; fa = fx;
   else
      b = x; fb = fx;
   end
end
disp(x)
try
    statement1
catch
    statement2
end
matlab作图
matlab提供了很多的方法来作图。通过图像我们能够直观的来观察数据中的重要特征。我们可以根据我们的数据来选择作图的类型,比如:line,bar,histogram,pie等;还可以用来做三维图形,比如:surfaces等。
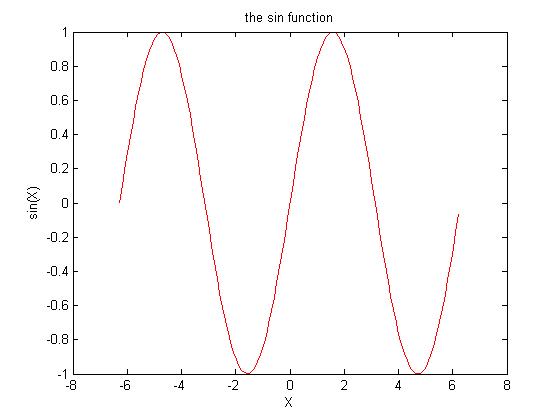
>>X=-2*pi:.1:2*pi
>>Y=sin(X)
>>plot(X,Y,'r');
>>xlabel('X');
>>ylabel('sin(X)');
>>title('the sin function');
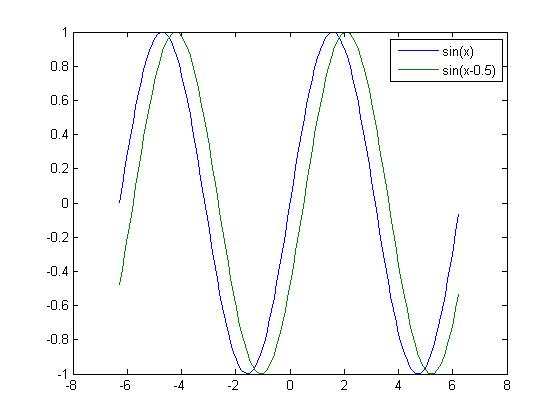
>>plot(X,Y,X,sin(X-.5));
>>legend('sin(x)','sin(x-0.5)'); %标注不同的函数
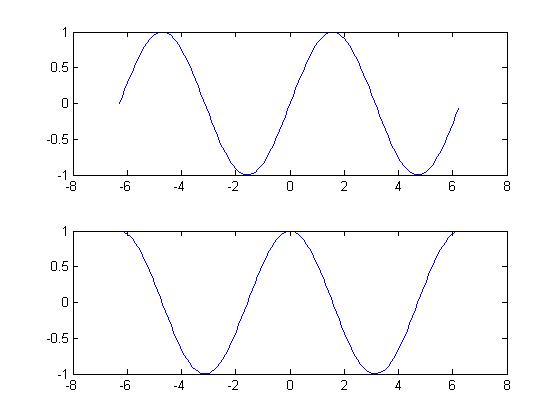
>>subplot(2,1,1);plot(X,sin(X));
>>subplot(2,1,2);plot(X,cos(X));
>> [X,Y]=meshgrid(-8:.1:8);
>> R=sqrt(X.^2+Y.^2)+eps;
>> Z=sin(R)./R;
>> mesh(X,Y,Z);
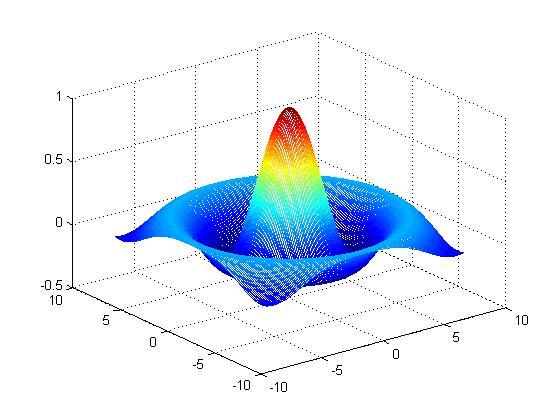
>>surf(X,Y,Z);
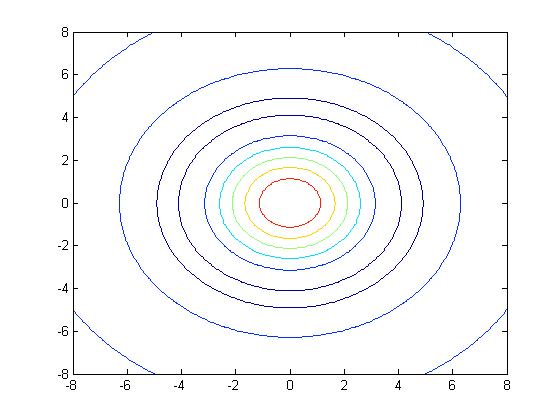
>>contour(X,Y,Z);
matlab入门
简介